FREE / NO REAL MONEY
Plinko Simulator: Bucket Probabilities, RTP and Virtual Drops
Choose rows and risk, drop virtual balls and compare the observed histogram with exact binomial landing probabilities. Payouts are a teaching model, not an operator paytable.
How it works & examplesUnderstand the calculation
Plinko RTP is a weighted average, not the average multiplier
Each row adds another left-or-right decision to a ball's path. Central slots can be reached by many paths, while edge slots have fewer. That is why averaging the displayed multipliers does not give the return of the board: each payout must be weighted by the probability of reaching its slot.
A common landing slot does not by itself tell you the long-run payout; check the model's house edge with RTP & House Edge Calculator: Expected Session Cost.
Compare row counts and risk settings while keeping the stake fixed. The risk setting changes the distribution of payouts, not a promise about your next ball. A run of small returns and a rare large multiplier can both occur under the same theoretical RTP. This simulator uses its own published mathematical model and virtual credits; its table is not a claim about the settings of a particular casino.
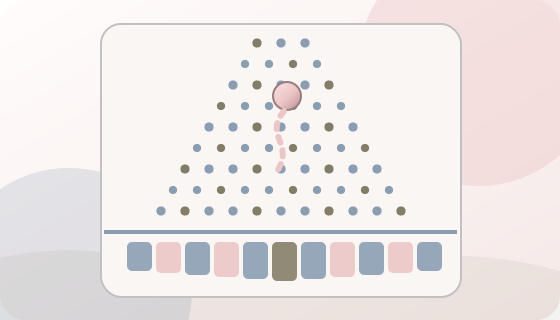
Play with virtual credits
Simulate 8–16 row Plinko, inspect exact binomial bucket probabilities, compare synthetic risk settings and separate theoretical RTP from sample results.
Try the simulator below. Input values stay in your browser; no account or money is involved.
Model assumptions: No. Virtual games use declared teaching models. Verify any actual operator’s payout rules independently.
Related interactive tools
- RTP & House Edge Calculator: Expected Session Cost
Calculate house edge, total turnover, expected gross return and expected loss from a stated RTP, a stake per round and number of rounds.
- Provably Fair Verifier for Revealed Seeds
Verify revealed server seeds, SHA-256 commitments and published Stake-style HMAC-SHA256 Dice or Plinko rounds directly in your browser.
- Mines Calculator: Safe-Tile Odds and Virtual Play
Calculate exact Mines survival probability, test safe picks on a playable 25-tile board and compare model payouts using virtual credits.
How to use the tool
Estimate how likely each Plinko landing slot is on a simplified equal-probability left/right board.
- Select 8–16 rows and a low, medium or high model risk setting.
- Drop a virtual ball to follow the peg decisions, or generate a sample of 100 or 1,000 outcomes.
- Check the probability histogram and expected return, not only the most recent payout.
Understanding your result
On an 8-row board the central slot is reached by 70 of 256 possible paths: 27.34375%. The payout multiplier can differ even when the path probability is identical.
Scope and limitations
The displayed slot payments are synthesized to 96.5% model RTP. Actual Plinko layouts and operator paytables can differ; an animation is not a physics measurement.
Before you rely on the result
- How the calculation works
Formulas, assumptions, rounding and model limits are documented on the methodology page.
- Check the current inputs
Use the odds, RTP, fees, bonus terms or other values currently shown by the operator or market.
Plinko probabilities: why middle buckets hit more often
In this Plinko model each row adds one independent left-or-right step. After n rows, landing in bucket k requires exactly k moves to the right, so the probability is C(n, k) / 2^n. That makes the middle buckets much more common than the edges even though every individual step is 50/50.
Risk settings in this simulator change the synthetic payout multipliers, not the binomial path probabilities. RTP therefore has to be calculated as a probability-weighted average of all bucket payouts, not as the simple average of the multipliers printed under the board.
Eight-row Plinko distribution
An eight-row board has 256 equally likely left/right paths but only nine landing buckets. Seventy different paths end in the centre bucket, while only one path reaches either extreme edge.
| Bucket | Paths | Landing probability |
|---|---|---|
| 0 or 8 | 1 each | 0.3906% each |
| 1 or 7 | 8 each | 3.1250% each |
| 2 or 6 | 28 each | 10.9375% each |
| 3 or 5 | 56 each | 21.8750% each |
| 4 | 70 | 27.3438% |
Why changing risk does not change where the ball lands
Low, medium and high risk can assign very different multipliers to the same buckets. In this model the path generator is unchanged, so bucket 4 on an eight-row board remains a 27.3438% event at every risk setting. What changes is the value attached to that event and therefore the variance of returns.
Theoretical RTP versus observed sample RTP
Theoretical RTP is Σ(probability of bucket × bucket multiplier). Observed sample RTP is what happened in the finite set of drops you ran. A 100-drop sample can sit far above or below the theoretical value because rare edge buckets have disproportionate payouts. A short sample is evidence of variance, not evidence that the published probability changed.
Worked example
On an eight-row symmetrical board, the middle bucket is reached with probability C(8,4)/2^8 = 70/256, about 27.34%. Its displayed multiplier is part of our synthetic model.
Does this simulator use Stake Plinko payouts?
No. Binomial probabilities are public mathematics, but our 96.5% payout tables are generated for teaching and are not operator paytables.
Questions about this calculation
Why are the middle slots more frequent?
There are more distinct left/right paths to the middle slots. The mathematical count is the binomial coefficient C(n,k).
Does changing risk alter slot probabilities?
Not in this model. Risk changes the synthetic payout distribution; with equal left/right decisions, the landing probabilities stay the same.
When is Plinko Simulator: Landing Probabilities and Demo the right tool?
Estimate how likely each Plinko landing slot is on a simplified equal-probability left/right board.
How should I read the result from Plinko Simulator: Landing Probabilities and Demo?
On an 8-row board the central slot is reached by 70 of 256 possible paths: 27.34375%. The payout multiplier can differ even when the path probability is identical.
What can Plinko Simulator: Landing Probabilities and Demo not tell me?
The displayed slot payments are synthesized to 96.5% model RTP. Actual Plinko layouts and operator paytables can differ; an animation is not a physics measurement.